Talk2m pro visualization tool

Talk2m visualization

Talk2m visualization, provided with the Talk2m pro plan, enables you to visualize historical data collected with Ewon Flexy gateways. Set up intuitive, visually engaging dashboards and reports to enhance your data-driven decision-making process. A simple introduction to the world of IIoT.

Ewon-talk2m-visualization

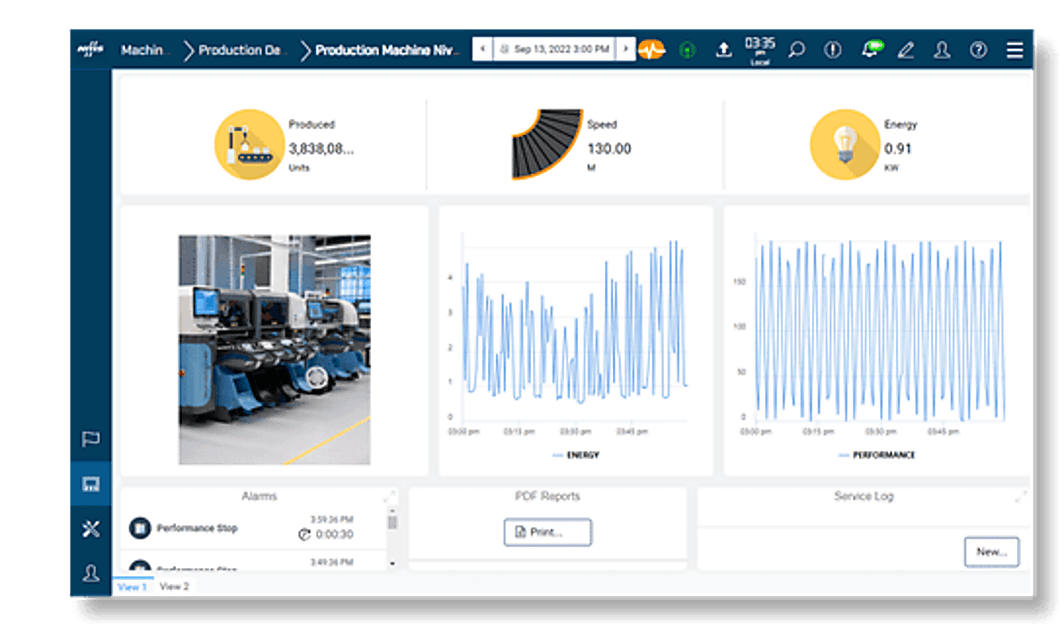
Elevate machine support with historical data dashboards

Start your IIoT journey: bring machine data to life and level up your machine support with Talk2m visualization. Easily visualize your data with intuitive dashboards and reports based on Ewon Flexy gateways' data. Available to all Talk2m pro users, it's a simple yet powerful way to get started with IIoT.

What you can do with Talk2m visualization

Leverage data in increasingly larger machine fleets

As the number of deployed machines to be serviced increases, your service team needs a way to go beyond simple remote access. Talk2m visualization provides tools to manage fleets with small teams by leveraging valuable machine data. Machine health, data trends, notifications and reports are designed to save time and easily help you managing groups of machines.

Support machines before a problem occurs

Technical support is often the most important factor for customer satisfaction and loyalty. Providing a high level of support at a low operational cost provides real value to customers. Talk2m visualization enables such advanced qualitative support. Notifications, which can be configured in relation to many aspects of a machine's operation and sent directly to support teams, help prevent any type of issues.

Small financial investment for large gains

IoT is not a new concept but having a simple, ready-to-go solution that scales all the way down to a small business is. Talk2m visualization requires only a small investment and will ease your digitalization journey. This will also minimize the support necessary to onboard customers and lead to a more profitable product offering.

Elevate support even at a small business level

Talk2m visualization scales effortlessly, providing businesses of all sizes with dynamic insights into their data. From initial monitoring to comprehensive analytics, it adapts to evolving needs, ensuring high customer satisfaction and operational efficiency. It offers a sophisticated support solution, even at a small business level.

Distribute customized reports easily

Talk2m visualization simplifies reporting by automating the process, generating reports instantly. With just a click, regulatory reports are created, saving time and ensuring compliance. Distribute customized reports over any desired time period. Share insights with key stakeholders, facilitating informed decision-making.

Try Talk2m visualization for free

Talk2m visualization demo

Fill in a form to get a free glimpse of Talk2m visualization. Try out its features for historical data dashboards, notifications, and reports. Discover it now with our free demo.